


Each August and September, millions of children in the U.S. return to classrooms, altering traffic patterns nationwide. More school buses run their routes, more families make morning drop-off trips, and more children are on foot or on bikes near busy intersections. Whether that shift translates into more traffic accidents has a more nuanced answer than commonly assumed, based on federal data. In this article, Mokaram Injury Lawyers, a Houston-based personal injury law firm, examines what the federal data actually shows.
What the Seasonal Fatality Data Actually Shows
The National Highway Traffic Safety Administration tracks monthly traffic fatality data through its Fatality Analysis Reporting System (FARS), a nationwide census of fatal crashes going back to 1975. That data does not support the claim that the back-to-school season produces a sharp increase in overall traffic fatalities.
FARS data shows that total traffic fatalities peak in summer, particularly in July and August, when vehicle miles traveled are highest. A NHTSA analysis of monthly and daily crash patterns covering data over several decades found that total daily fatalities trend upward from January through July, plateau through the summer, and then decline after September. That pattern does not align with the timing of the traditional school year.
The Federal Highway Administration's Traffic Volume Trends reports, which track vehicle miles traveled monthly using data from approximately 5,000 continuous counting locations nationwide, show that August consistently produces among the highest VMT of any month. In August 2023, total travel on all U.S. roads was estimated at 288.4 billion vehicle miles. September 2023 came in lower at 275.6 billion vehicle miles, a decrease compared to the summer peak.
Crash volume generally increases as vehicle volume increases. The back-to-school transition coincides with a period when total driving volume is beginning to ease from its summer peak, and not when overall crash volume is climbing.
Where Pedestrian Data Tells a Different Story
The pattern differs when examining pedestrian fatalities, particularly among children.
The same NHTSA monthly analysis found that pedestrian fatalities follow a different seasonal pattern than total traffic fatalities. While overall crash deaths tend to fall after September, pedestrian fatality rates trend upward through the fall and into the winter months. NHTSA researchers attribute this partly to reduced daylight hours as the year progresses, which increases the share of walking that occurs in the dark, a documented risk factor in pedestrian deaths.
NHTSA's 2023 pedestrian data shows that 77% of all pedestrian fatalities that year occurred when it was dark. That proportion becomes particularly relevant as school schedules place children on sidewalks and crosswalks during early morning and late afternoon hours, when daylight decreases through the fall months.
NHTSA's 2023 Children data report shows that 63% of child pedestrian fatalities in traffic crashes occurred during weekday crashes, defined as 6 a.m. Monday through 5:59 p.m. Friday. This timing corresponds with typical school schedules. In 2023, 171 children were killed as pedestrians in traffic crashes, representing 17% of all child traffic fatalities that year.
School-Transportation-Related Crashes Are a Specific Federal Category
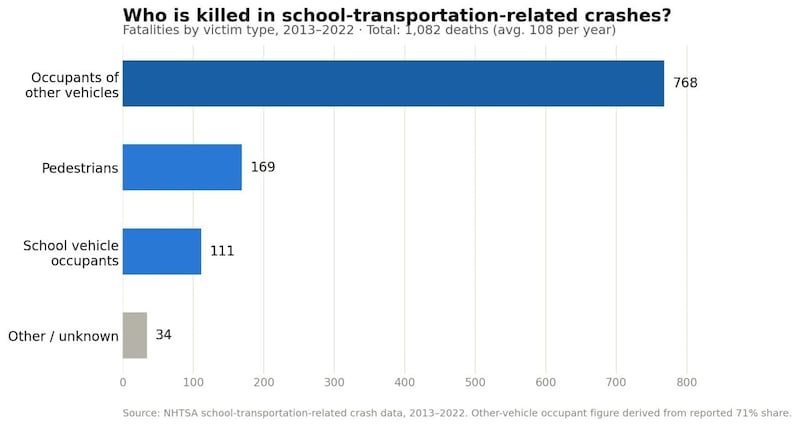
NHTSA tracks a distinct data category called school-transportation-related crashes, which covers any fatal crash involving a school bus or a vehicle being used as a school bus. The most recent 10-year report, covering 2013-2022, found that 1,082 people were killed in such crashes over that period, averaging 108 fatalities per year.
The breakdown highlights where risk is concentrated: 71% of those killed were occupants of other vehicles, not students. Pedestrians accounted for 169 of the deaths over the 10 years, more than the 111 school transportation vehicle occupants killed. Among school-age pedestrians, more fatalities occurred between 3 p.m. and 3:59 p.m. than during any other hour of the day, according to the same report, a period that corresponds with school dismissal and afternoon travel.
That concentration of risk during dismissal hours is one reason AAA has run its "School's Open — Drive Carefully" campaign since 1946, which encourages reduced speeds and increased driver awareness during school travel periods.
Teen Drivers: A Separate but Related Risk
AAA's back-to-school safety data also identifies teen drivers as a distinct risk factor during the fall period. More than one in four fatal crashes involving teen drivers occurs between 3 and 7 p.m., the after-school window, according to AAA, which draws on NHTSA's crash data. Car crashes remain the leading cause of death for teenagers in the United States.
NHTSA's 2023 Children report recorded 1,019 total child traffic fatalities, which was the lowest rate in the ten years covered by the report, at 1.71 per 100,000 child population. That rate has declined over time, even as overall pedestrian and cyclist fatalities nationally have increased.
What the Data Shows — and What It Does Not
Federal data does not show a dramatic spike in total traffic accidents at the start of each school year. Instead, the data identifies specific, recurring risks that concentrate during school-related hours and the fall period:
- Pedestrian fatalities among children are disproportionately concentrated during weekday hours that align with school schedules.
- The 3-4 p.m. hour is the most dangerous for school-age pedestrians in school-transportation-related crashes.
- Pedestrian fatalities broadly increase in fall and winter as daylight decreases.
- Teen driver crashes are more common in the after-school window.
Mokaram Injury Lawyers
Total vehicle miles traveled decline from their summer peak as school resumes, which may contribute to lower overall crash volumes. The school-specific risks documented in federal data are concentrated in particular hours, locations, and populations rather than reflected in a broader seasonal surge in fatalities.
This story was produced by Mokaram Injury Lawyers and reviewed and distributed by Stacker.